Mercator GeoSystems
Buy drive time data
Buy a drive time map
Buy a postcode data map
Contact us
Accounts
Postcode Mapper
Welcome to the online Mercator GeoSystems postcode data mapping portal.
Welcome to the online Mercator GeoSystems postcode data mapping portal.
This site enables you to visualise your postcode-tagged data on a map. This data could be a file of customers, a list of prospects, incidents or any other postcode-based data. Your map can either place a dot on the map for each postcode enabling you to quickly and easily identify clusters of related data, or 'aggregate' the data to enable a shaded map to be created enabling areas to be 'banded' into classes helping identify broad trends in your data.
From this page you can specify the options for your map, the details you would like to include and then buy your map quickly and easily using a credit card. After you have made your selections from the options below you can preview your map, or proceed directly to the payment page.
To watch our introductory tutorial on YouTube click here :
http://www.youtube.com/watch?v=dFqeZfjhZp8
Postcode Data
Select a file on your computer that contains a list of postcodes (e.g LS16 6TZ), postcode sectors (LS16 6), postcode districts (e.g LS16) or postcode areas (e.g LS).
Data file :
Your file must be a text file which can easily be created from software such as Excel or Access. A header row is not required, but the postcode must be in the first column.
Alternatively you can copy and paste your data into this text box :
Your data can either have just a list of postcodes (or sectors,districts etc) or a postcode and then a comma followed by a numeric value used to represent the number of 'items' (e.g customers, incidents) at that postcode. For dot maps repeated postcodes, or postcodes with a larger value, will have a larger dot on the map.
Show content options
Show map options
Show data options
Show delivery options
Content Options
Select how you would like your data to be displayed. If you do not specify a title a default one will be supplied.
Which type of map do you wish to produce :
Dot Map
Shaded Map
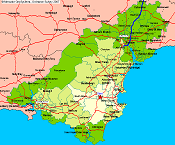
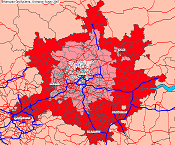
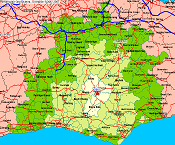
Examples :
Dot map
Shaded map
Map data at :
Postal Areas
Postal Districts
Postal Sectors
CCGs
Health Areas
Map title :
Map Options
These options affect how your final map will look.
Show roads
Data labels
Highlight missing data
Show place names
Include smaller places
Colour scheme :
Green
Red
Purple
Colour scheme :
Black
Green
Red
Purple
Dot size :
Small
Medium
Large
Green
Red
Purple
Adjust map zoom :
-25%
-10%
None
+10%
+25%
Custom breaks :
Enter 4 values separated by commas that specify the lower and upper limits for 3 bands. e.g 0,100,200,300
Data Options
If you wish to have any accompanying data supplied with your map please select it here.
Include data table
There are no options here for dot maps.
Delivery Options
Choose the format you wish to receive your map in. You can either receive it as a PDF file or as an HTML web page, either of which you can save locally.
PDF is suitable for printing, emailing and other forms of electronic distribution.
HTML is better suited where you wish to access the raw 'elements' that make up your map to use within your own software such as Word etc.
Delivery format :
PDF
HTML
Make larger image
Need help or got a question?
Click
here
to contact us and get assistance.
Please note that in order to prevent abuse of this service the preview map is a slightly pixelated (blurred) version of the final map you will receive should you buy a map. The final map is of a much higher quality.
You can view a final-quality sample PDF
here
, a sample PNG image (when delivered as HTML)
here
and
here
(larger version). These samples are exactly the same quality that you will receive when you purchase your map.
Current map price :
£
40
+ vat
If you feel we can improve this service in any way please click
here
to send us feedback.